
By: Marla Dukharan
July 31, 2026
Cayman’s population has doubled in 22 years and is closing in on 100,000. Who is that growth really for, who is paying for it, and who gets to decide what happens next? This report follows the money from work permits to Government revenue to construction, and then hands the question to the people it belongs to: Caymanians.
On June 14th 2026, for the first time in history, a referendum was held to determine whether a country’s population growth should be limited / capped. This referendum was prompted by the apparent struggles with the perceived effects of population growth on a society. In the end, the people of Switzerland voted not to limit the growth of their population.
The people of The Cayman Islands appear to be experiencing similar struggles. Like Switzerland, Cayman offers a safe and peaceful environment, a high standard of living and relatively high wages, making it an attractive place to live, work, and raise families. As such, the population of the Cayman Islands has doubled in the last 22 years, and is now approaching 100,000.
This analytical paper unpacks the relationship among Cayman’s population growth, the level of economic activity or GDP, Government revenue, employment opportunities for locals, construction, cost of living / inflation, etc., and ultimately to ask the question (via a brief anonymous online survey, which has now closed) how do Caymanians feel about population growth?
I do hope this paper is helpful. The survey has now closed; thank you to everyone who took the opportunity to express your views on population growth in Cayman.
How do the people of Cayman feel about all of this?
The survey has now closed. Thank you to everyone who shared their views; the results will be analyzed and published in due course.
The uniqueness of the Cayman Islands
It has been said that the best way to predict your future is to create it.
And while this is not always entirely possible for everyone, the people of the Cayman Islands have been blessed and empowered with a long history of closely shaping their destiny in many ways, via their stable and strong democratic institutions, as well as their culture of advocacy, complemented by the responsiveness of the authorities.
A few weeks ago, while walking on Seven Mile Beach, I was horrified at the amount of litter on the public volleyball beach in front of the Hotel Indigo. I posted about it on LinkedIn and reached out to Miss Sandra at Cayman Marl Road (CMR) who was able to get in touch with the authorities. By the next morning, the entire beach was thoroughly cleaned up! Where else would this happen so quickly? If at all? Yes, Cayman is that girl!
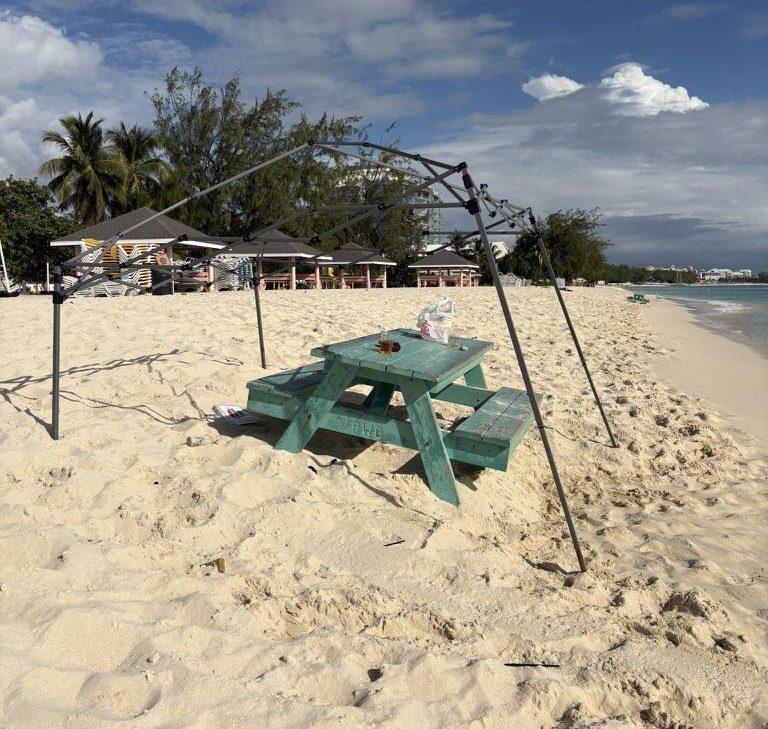
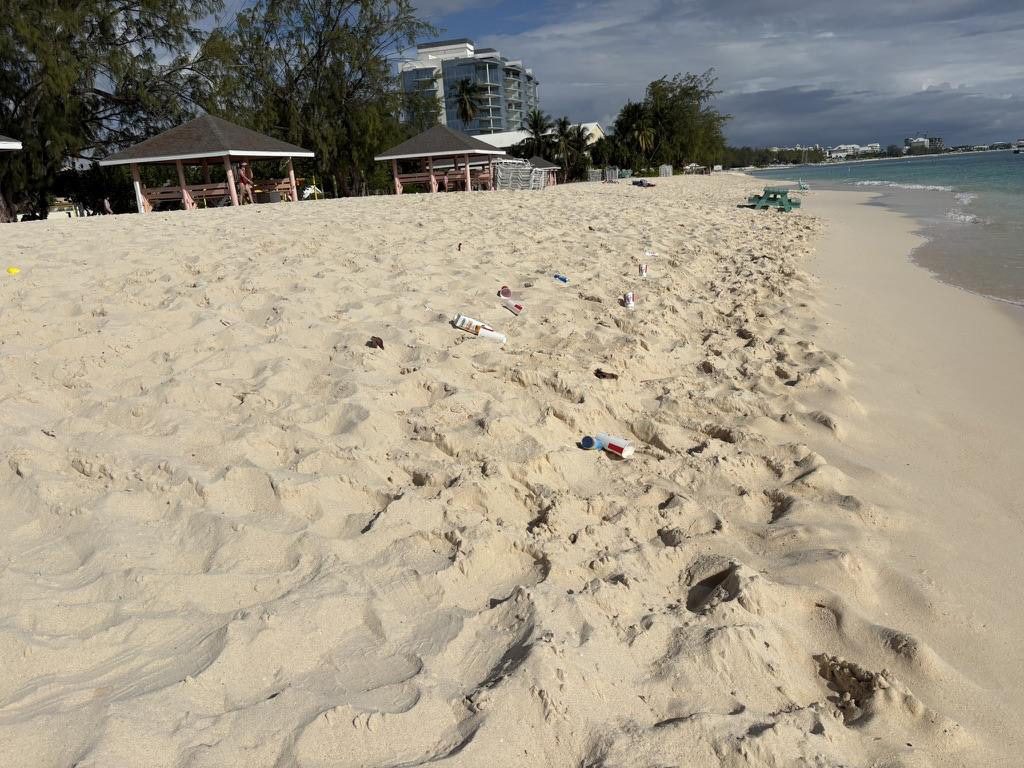
Seven Mile Beach, including the public volleyball beach in front of the Hotel Indigo. By the next morning, it was thoroughly cleaned up.
And this is why I love Cayman. Yes – the natural beauty and the food (fell in LOVE with cassava cake on my last trip – IYKYK!) and the people are all next level, but it goes much deeper than that. The Cayman Islands is still the best-run country in the Caribbean, IMHO. The people of Cayman aren’t content to coast on what they’ve got. They want to do better and be better, and they back it up – world class!
Population growth
The United Nations expects the global population to peak during this century – meaning the world’s population will begin to shrink within the next 74 years. Indeed, 1 in 4 people around the world live in a country whose population has already peaked, and is declining.
The 14 Caribbean countries whose populations have already peaked and are declining are Barbados, Cuba, Curacao, Dominica, Guadeloupe, Jamaica, Martinique, Montserrat, Puerto Rico, St. Kitts and Nevis, Saint Martin, St. Vincent and the Grenadines, Bermuda, and the US Virgin Islands. The rest of the Caribbean will see their population peak and start declining in the next 30 years, except for the Dominican Republic, French Guiana, Guyana, Haiti, Suriname, and The Cayman Islands. In other words, the Cayman Islands is one of only 6 Caribbean countries expected to see population growth beyond 2054.
According to the UN World Population Prospects report 2024, the population of the Cayman Islands is projected to reach 107,000 in 30 years, peaking at 118,000 in 2098. In December 2025, the Economics and Statistics Office (ESO) of the Cayman Islands estimated the population at 90,577.
Population: Cayman IslandsNumber of persons020,00040,00060,00080,000100,00033,33252,46660,41390,577199019911992199319941995199619971998199920002001200220032004200520062007200820092010201120122013201420152016201720182019202020212022202320242025Source: Cayman Islands Economics and Statistics Office, Marla Dukharan
According to World Population Review, Cayman has the fastest annual population growth rate in the Caribbean at 1.78%, followed by French Guiana at 1.66%. And although many of them have declining populations, Bermuda, Barbados, Aruba, Saint Martin, Saint Barths, Haiti, Curacao, Puerto Rico, and Grenada (in that order) all have higher population densities than the Cayman Islands.
The 2021 Census found that the average number of children per female in the Cayman Islands is 1, which is well below the population replacement rate of about 2.1 live births per female. This means that without net inward migration, the population in Cayman – like many Caribbean countries – would be declining.
Population and gross domestic product (GDP)
Population acts both as a driver and a beneficiary of economic activity and growth in general. But in Cayman, population has been found to be highly positively correlated with GDP or economic activity. The Auditor General stated in a November 2024 report1 that “Between 2018 and 2022, there was a high correlation between GDP growth and population growth. There is a stronger correlation between GDP growth and the non-Caymanian population.”
Population and current GDPNumber of persons, KYD millionGDP at current prices (KYD million)PopulationGDP at current prices (KYD million)Population01,0002,0003,0004,0005,0006,0007,00050,00060,00070,00080,00090,0002006200720082009201020112012201320142015201620172018201920202021202220232024Source: Cayman Islands Economics and Statistics Office, Marla Dukharan
Specifically, for the 2018-2022 period, the correlation between nominal GDP and the Caymanian population was 86%, and 97% between nominal GDP and the non-Caymanian population.
But correlation is not the same as causation, and the Auditor General’s report does not suggest whether higher population causes the economy / GDP to grow, or whether economic growth causes higher population levels, or both. While it is likely that Cayman’s growth creates jobs and makes it attractive to foreign workers, it is also likely that foreign workers (and their families) coming to Cayman create economic activity and GDP growth. This is the dynamic examined and discussed throughout this paper.
Based on the analysis to follow, it would appear that the three main channels via which foreign workers create economic activity and GDP growth in Cayman, are:
1
Through work permit fees that the Government collects, and then spends mostly on personnel costs, as 70% of public sector workers are Caymanian.
2
Through foreign workers’ demand primarily for construction (housing, workplaces, schools, roads, airports, etc.), but also their demand for other goods and services.
3
Through coercive Government revenue collected via foreign workers’ consumption and other economic activity, which the Government then spends, again, mostly on personnel.
4
The state’s spending on personnel supports these employees’ demand for construction (housing, workplaces, schools, roads, airports, etc.) and for other goods and services. The economic activity created by public sector workers also contributes to Government revenue, therefore.
The incentive loop
How population growth, Government revenue and construction feed each other in Cayman
Population grows via(high-wage) foreign workersWork permit fees + coerciverevenue lift Government incomeGovernment spends it, mostly onpersonnel (70% Caymanian)Demand for construction, goodsand services grows GDPand higher GDP attracts more workers, and more revenue…The dynamic examined throughout this report. Each link is discussed, with its correlation, in the sections below.
1 For the 5-year period 2018-2022, the Auditor General’s report analyzed the correlation between non-Cayman population and GDP, which was 97%, while for the Caymanian population and GDP the correlation was 86%.
Government and jobs
Via their fiscal policy, Governments generally target the level of inflation, economic activity and employment that they want to support if not create in their economy, towards a happy electorate – which every Government wants. But the Cayman Islands Government must primarily target their overall fiscal balance and level of debt, to comply with the Framework for Fiscal Responsibility (FFR) over and above everything else.
As discussed earlier, population growth, particularly via foreign workers who move to Cayman, is associated with higher GDP growth in Cayman. But population growth via foreign labour is also an important source of Government revenue – via work permits and other fees. The Government also earns other forms of coercive revenue when foreign workers engage in consumption and broader economic activity.
Number of work permits and Gov’t revenueTotal work permits; KYD millionTotal work permitsGov’t revenue in KYD millionTotal work permitsGov’t revenue in KYD million010,00020,00030,00040,0006007008009001,0001,1001,2002015201620172018201920202021202220232024Source: Cayman Islands Economics and Statistics Office, Marla Dukharan
And whereas most Governments generally collect fiscal revenue from workers via personal income tax, in Cayman, where the majority of the workforce is foreign, work permit fees are an important source of Government revenue collected upfront – before the foreign worker ever collects a salary. And the higher the wage bracket of the position, the higher the work permit fee. As such, Cayman’s Government is highly incentivised to allow the population to grow via (high-wage) foreign workers. It stands to reason also, that the Government is incentivized to restrict foreign workers from acquiring Permanent Residency (PR) in Cayman, as the revenue collected from that foreign worker will decline just as residency implies some obligations of the state for that foreigner.
Gov’t revenue derived from work permit feesKYD million02040608010012014058.56571.67778.279.788.987.39986.8107.4119.9127.6138.920112012201320142015201620172018201920202021202220232024Source: Cayman Islands Economics and Statistics Office, Marla Dukharan
Furthermore, we found a 96% correlation between Government spending and public sector employment levels. Indeed, a recent Cayman Compass article highlighted a recent Auditor General report which stated “Government expenditure increased by 26 per cent, from $1.1 billion in 2020 to $1.4 billion in 2024, and public servants’ remuneration increased by 37 per cent, from $521 million in 2020 to $712 million in 2024.”
At 8,302 employees, the public sector workforce was roughly 13% of the total labour force of 64,989 in December 2025, making the Government the largest single employer in Cayman.
Employment composition by private and public sectorNumber of jobs; KYD millionPublic Sector jobsPrivate Sector jobsGov’t expenditure in KYD millionPublic + Private Sector jobsGov’t expenditure in KYD million010,00020,00030,00040,00050,00060,0006,39038,4976,63740,7576,89734,7477,22737,2147,29249,0637,55050,9547,89451,4996007008009001,0001,1001,2002018201920202021202220232024Source: Cayman Islands Economics and Statistics Office, Marla Dukharan
We also found a 91% correlation between the number of public sector workers and the number of work permits, and a 75% correlation between the level of public sector employment and private sector employment. This demonstrates the outsized role that the Government plays in the job market and the wider economy, but also the extent to which work permits support Government spending in general, and public sector jobs more specifically.
Who holds the permits
A sectoral breakdown of work permits in 2024 published by ESO shows the top three sectors employing foreign workers as construction at 6,256 work permits or 17% of total work permits, Accommodation and Food Service activity at 6,308 work permits at 17.2% of total, and Financial and Insurance Activities plus Administrative and Support Service Activities at 16.8% of total. These three sectors and the Government revenue they contribute, are therefore the most significant supporters of Government spending and public sector employment.
Monthly Basic Earnings Non-CaymanianShare of total workforce (Caymanian+Non-Caymanian) at earnings level (%)Non-Caymanians as % of Total Wage EarnersShare of Total Non-Caymanian Workers020406080>8,2504796,429 ��� 8,2504175,352 ��� 6,4294284,653 ��� 5,35248104,000 ��� 4,6534283,370 ��� 4,0003772,764 ��� 3,3704492,128 ��� 2,76462121,374 ��� 2,1287215<1,3747115Source: Economics & Statistics Office, Marla DukharanMonthly Average Compensation by IndustryKYD/Month02,0004,0006,0008,00010,000Professional, sci.and tech9,743Financial and insurance8,954Real estate7,842Electricity6,680Human health & social work5,979Public admin.5,222Education4,733Info. & comm.4,723Water supply & waste management4,681Mining & quarrying4,215Transportation & storage4,200Arts, enter. & recreation3,956Construction3,690Wholesale and retail trade3,214Other service activities3,062Admin & support services2,880Manufacturing2,850Agri., forest & fishing2,580Rest. and Food2,513Accommodation2,491Source: Economics & Statistics Office, Marla Dukharan
The Government is therefore incentivized to support these sectors in order to earn fiscal revenue; construction, accommodation and food service, financial and insurance, and administrative and support services.
Work permit fees are proportional / tied to the level of compensation, so the Government is incentivized to prioritize high-wage foreign workers, who occupy >40% of the highest-paid posts. Foreign workers also occupy >70% of the lowest-paid posts, and overwhelmingly dominate the lowest wage brackets. As such, the Government is highly incentivized to support work permit holders from the highest-paid sectors; Professional, scientific and technology, Financial and Insurance, Real estate, and Electricity.
Parliament recently passed a motion to restrict non-Caymanian real estate agents in Cayman, so it is possible that work permit revenue from this sector may decline as a result.
Also note that “Public Administration” attracts the 6th highest monthly average compensation across all sectors in Cayman. And as mentioned earlier, there is a 96% correlation between Government spending and public sector employment. It would appear therefore that the Government of the Cayman Islands is engaging in a type of fiscal redistribution much like that of a petro-state, but without a sovereign wealth fund financed by royalties on their finite and depleting natural resource (physical space / real estate, in the case of Cayman).
The engine room
Roughly half of the Government’s revenue comes from the Financial Services Sector, which is also the single largest contributor to GDP, supporting population growth directly via foreign workers (and their families), and indirectly via the knock-on economic activity, employment, and coercive fiscal revenue that this sector creates.
As such, the Government is highly incentivised to support the Financial Services sector in Cayman, over and above all other sectors. The fate of these two appear to be more closely tied together than any other public-private relationship in Cayman.
And given that over half of core Government’s annual budget is spent on personnel costs, and given that the Financial Services Sector contributes roughly half of the Government’s revenue, that sector therefore indirectly employs the majority of the public sector workforce, 70% of which is Caymanian.
In the Government’s own words
The Minister of Finance and Economic Development stated in the 2026-2027 Budget Address “our revenue inflows generally follow the same path as our Gross Domestic Product (GDP) over the years, and the link is incredibly strong. In simple terms, when GDP goes up, revenue does too. This connection is so close that the correlation between Government’s revenues and the Islands’ GDP, has been calculated at 99.9 percent: indicating that Government’s revenues and the Islands’ nominal GDP move in almost perfect unison. So, when projecting future revenues, a first step is to forecast GDP. This will allow the Government to confidently project future revenue levels.”2 (emphasis added)
Gov’t revenue and current price GDPKYD millionGov’t revenue in KYD millionGDP at current KYD millionGov’t revenue in KYD millionGDP at current KYD million02004006008001,0001,2003,0003,5004,0004,5005,0005,5006,0006,50020112012201320142015201620172018201920202021202220232024Source: Cayman Islands Economics and Statistics Office, Marla Dukharan
This means that the Government of the Cayman Islands is heavily incentivized to support and / or attempt to create economic activity and GDP growth, in order to earn higher levels of fiscal revenue.
How might they do that?
2 We found the correlation between Government revenue and GDP to be 98.9% – not materially different from the Minister of Finance’s number.
Leakage and multipliers
The extent to which Government spending creates knock-on economic activity and GDP growth is measured by a fiscal multiplier, which tells us out of every dollar the Government spends, how much stays in the domestic economy and multiplies, creating further economic activity.
The Caribbean’s high import dependence (estimated at 80-90% of food alone) means the level of (fiscal) leakage is high, such that only a small portion of what is spent locally actually stays within the domestic economy. This in turn means that our fiscal multipliers are among the lowest in the world; 0.14 for Barbados, 0.11 for Jamaica, 0.18 for Trinidad and Tobago, and negative for Guyana. This means that for every dollar the Government spends in Barbados, only 14 cents grows the economy or GDP of Barbados, 11 cents in Jamaica, 18 cents in my country Trinidad and Tobago, and in Guyana, for every dollar that the Government spends, GDP actually contracts!
This suggests that in general, Government spending is not the most effective way to create growth in the average Caribbean economy. So what does create growth? I discussed this at length in a 2024 report, but basically (the non-imported components of) exports and investment drive growth in most Caribbean countries.
In the Cayman Islands, the construction sector (which is physical investment) was found by the ESO to have the highest output multiplier in the economy. This means that construction activity creates the most knock-on activity across the broader economy; “for every $1.00 of additional construction output demanded, total output in the economy would increase by $2.56. The employment multiplier estimates that for every $1 million dollars worth of construction output demanded, 16 additional workers would be demanded across the economy. The high multiplier in the industry largely emanates from its heavy reliance on output from other domestic industries…manufacturing which provides concrete and finance and insurance and professional activities…”3
3 Note that the Finance and Insurance sector is the single largest contributor to GDP and to Government Revenue in the Cayman Islands, but this is distinct from the construction sector having the highest output multiplier. The tourism sector also drives significant construction activity for hotels and short term rental units, airports, and other infrastructure, for example.
Government and construction
Given that higher levels of construction activity (more so than in any other sector in the economy) will cause GDP or the economy to expand, which in turn (according to the Government) will mean higher fiscal revenue, it stands to reason that the Government is heavily incentivized to support construction activity more so than any other sector, in order to grow GDP, to therefore earn more fiscal revenue.
Construction GDP, Total GDP and Fiscal RevenueKYD millionConstruction GDPTotal GDPFiscal RevenueConstruction GDP + Total GDPFiscal Revenue01,0002,0003,0004,0005,0006,0007,0005006007008009001,0001,1001,20020112012201320142015201620172018201920202021202220232024Source: Cayman Islands Economics and Statistics Office, Marla Dukharan
“
But what drives demand for construction activity? People do!
People need somewhere to live, somewhere to work, somewhere to go to school, tourists need accommodation, restaurants and attractions, and we all need somewhere to send our waste – and all of these require construction.
Cayman Compass recently highlighted; “A government-commissioned housing study found that Cayman is already short by more than 3,000 homes and will need 5,000 additional units over the next 15 years just to keep pace with population growth. That is a rate of construction that would require tripling current building activity for a decade… The necessary infrastructure for expanding housing – from roads, sewer systems and water to environmental and sustainability safeguards – are not adequate to support substantial growth.”
Recall from the Auditor General’s report that growth in the non-Caymanian population in particular, means higher economic activity or GDP. And recall that higher GDP means more Government revenue, according to the Government. And recall that work permit fees increase with the wage bracket. So Cayman’s Government is heavily incentivized to support growth of the non-Caymanian, high-wage population in particular, in order to earn more fiscal revenue directly, and to drive construction activity, which drives growth in GDP and higher fiscal revenue.
Population and planet
Population size, and the attendant consumption, construction activity and infrastructure, must all have implications for our planet. And while scientists caution that the planet has already exceeded its population carrying capacity, the good news is that the global population will begin to decline naturally later this century as discussed earlier. But what about Cayman’s carrying capacity?
A recent Cayman Compass article said “Consultants projected in a 2022 report that Cayman would reach the absolute limit of what could be physically imported through the port when the population approaches 100,000.” But we have no clue from an ecological standpoint, what population size could be comfortably sustained and how, in the Cayman Islands, especially in Grand Cayman.
Population and merchandise importsNumber of persons, KYD millionMerchandise Imports (KYD Millions)PopulationMerchandise Imports (KYD Millions)Population02505007501,0001,2501,5001,75050,00055,00060,00065,00070,00075,00080,00085,00090,000200720082009201020112012201320142015201620172018201920202021202220232024Source: Cayman Islands Economics and Statistics Office, Marla Dukharan
As Sustainable Cayman outlined, “Cayman needs an independent carrying capacity study to understand the limits for housing, transport, schools, utilities and ecosystems…this protects Cayman’s quality of life while supporting balanced development.”
Carrying capacity information is crucial to any policy decision to allow the population to continue to grow via work permits / inward migration, yet here we are, witnessing steady inorganic population growth in the absence of this data, as Cayman fast approaches the 100,000 limit stipulated for the cargo port. One would hope that the authorities will at least respect that 100,000 cargo port limit, lest they potentially jeopardize the food and fuel security of everyone in Cayman.
What it costs to live here
Cayman Islands GDP per capita and World GDP growthThousand USD, Percent changeCI GDP per capita in ‘000 USDWorld GDP growthCI GDP per capita in ‘000 USDWorld GDP growth02040608010082.681.975.874.975.776.578.380.179.78081.985.889.787.189.584.886.587.1-4-202468200720082009201020112012201320142015201620172018201920202021202220232024Source: Cayman Islands Economics and Statistics Office, World Bank, Marla Dukharan
Cayman has the second highest GDP per capita in the region after Bermuda, and indeed, one of the highest in the world. The economy has also grown steadily for the past several years, making it an attractive place to invest, live, work, raise families, etc, supporting further population growth – and construction. But this virtuous cycle might have limits, and some feel that Cayman could be a victim of its own success.
Cost of Living RankRank highest cost to lowest, Bermuda=100.20.40.60.811stBermuda2ndCayman Islands3rdTurks and Caicos Islands4thBarbados5thBritish Virgin Islands6thBahamas7thJamaica8thDominica9thGrenada10thTrinidad and Tobago11thGuyanaSource: Penn World Tables, World Bank, Marla Dukharan
The Cayman Islands has the second highest cost of living in the Caribbean after Bermuda, and indeed, one of the highest in the world – but unlike Cayman, Bermuda’s population is actually declining. And this high cost of living in Cayman has become a major political, business, and social issue. Many Caymanians lament that they are unable to afford to retire in Cayman and will likely have to leave, as some have done, to Panama or Portugal for example.
Furthermore, Cayman’s inflation rates are low by regional comparison, and declining; 2.5% in 2024 and 1.3% in 2025. Cayman had the 9th lowest inflation rate regionally in 2025 at 1.3%, which is also below the regional average around 2% and the global average of 4.2%!
But what are the channels via which Cayman’s population might affect inflation?
Cayman Islands Inflation rate and Population growthPercent Change y/y (%)InflationPopulation growthInflationPopulation growth-4-20246810-20-10010203040502000200220042006200820102012201420162018202020222024Source: Cayman Islands Economics and Statistics Office, Marla Dukharan
There is a 0.98 correlation between the population growth rate and the inflation rate in Cayman. While we don’t have enough data to prove causation, it would be much more reasonable to presume that higher population levels alongside imported inflation and customs duties etc. contribute to the overall price level rising vs higher prices somehow causing more people to relocate to Cayman.
And while population is closely tied to inflation in Cayman, this is not necessarily the case for other Caribbean countries. Some Caribbean countries with flat or declining populations (like Bermuda, Barbados, Curaçao, Dominica, Jamaica, St. Kitts and Nevis, and Saint Martin) have much higher inflation levels than Cayman.
Caribbean Inflation, 2025End of period, percent change y/y-2024681012-0.90.30.30.40.40.40.50.71.31.51.61.61.81.822.12.533.14.5511.4Caribbean Av.=2.1AnguillaGrenadaSt. LuciaArubaTrinidad and TobagoBelizeSt. VincentBahamasCayman IslandsSt KittsDominicaBarbadosBritish Virgin IslandsSint Maarten (av.)BermudaCura��aoGuyanaTurks and Caicos IslandsAntigua and BarbudaJamaicaDominican RepublicSurinameSource: IMF, Central Banks, Marla Dukharan
We used ESO data on the Consumer Price Index basket of goods and services (which is used to calculate the inflation rate) and calculated the changes in prices from December 2016 to December 2024, sorted by the highest to the lowest change over the eight year period.
What climbed the most
- White eggs, grade A (1 dz)+220%
- Women’s casual shoes (avg)+114%
- Plastic cutlery (48 pc)+109%
- Ripe plantain (per lb)+107%
- Cane sugar (4 lbs)+101%
What barely moved, or fell
- Local beer, 12 oz+1%
- Metformin 500 mg (30 tablets)+2%
- Men’s casual short pants (avg)−16%
- Cribs−20%
- Lansoprazole 30 mg (30 tablets)−26%
“
The price of eggs at Foster’s supermarket is now super-low (no yolk! Hahah) so I am not too concerned about that, but women’s shoes and ripe plantain??!! Must be a conspiracy!
(This list makes for great dinner party conversation by the way!) Every item in the CPI basket, December 2016 to December 2024, is below – search it, sort it, and see how your own basket did. Apartment and studio rents carry a Housing tag.
Biggest increase first Biggest decrease first A to Z
| Item | Quantity | Change, Dec 2016 to Dec 2024 |
| White Eggs – Grade A | 1 dz | +220% |
| Women’s Shoes – Casual – Man Made | Average | +114% |
| Plastic Tableware – Cutlery | 48 pc | +109% |
| Plantain – Ripe | per lb | +107% |
| Cane Sugar | 4 lbs | +101% |
| Girls’ Shirts/Blouses – Casual | Average | +98% |
| Enriched Parboiled Long Grain Rice | 5 lb | +95% |
| Salt – Iodized | 26 oz | +91% |
| Bleaches – Concentrated | 121 oz | +91% |
| All Purpose Flour | 5 lb | +84% |
| Butter – Salted | 227g | +83% |
| Sweet Potato | per lb | +82% |
| Studio Housing | George Town | +75% |
| Apartment – 3 Bedroom Housing | George Town | +74% |
| Apartment – 2 Bedroom Housing | West Bay | +72% |
| Men’s Shoe – Casual – Man Made | Average | +72% |
| Apartment – 2 Bedroom Housing | Bodden Town | +71% |
| Apartment – 2 Bedroom Housing | George Town | +69% |
| Lettuce, Iceberg | Each | +66% |
| Tomatoes – Slicing | per lb | +65% |
| Women’s Shoes – Dress – Man Made | Average | +65% |
| Dish Washing Liquid/Powder | 14 fl oz | +60% |
| Cough, Colds and Flu Preparations – Nasonex | 1 Bottle/50 mcg | +59% |
| Apartment – 3 Bedroom Housing | West Bay | +58% |
| Stew Beef | per lb | +58% |
| Girls’ Dress – Casual | Average | +57% |
| Apartment – 1 Bedroom Housing | West Bay | +56% |
| Corn Flakes (Original) | 24 oz | +54% |
| Sodas and carbonated drinks – Bottle | 20 oz | +53% |
| Apartment – 1 Bedroom Housing | Bodden Town | +53% |
| Tonic, Vitamins and Minerals – Men’s | 60 Tablets | +52% |
| Apartment – 3 Bedroom Housing | Bodden Town | +52% |
| Paper Napkins – 2ply | 100 ct | +50% |
| Corned Beef – Canned | 12 oz | +49% |
| Infants’ and Children’s Shoes – Man Made | Average | +49% |
| Drugs for Hypertension – Amlodipine 5 mg | 30 Tablets | +47% |
| Condensed milk | 395g | +47% |
| Salmon Steaks | per lb | +46% |
| Laundry/Detergents – Liquid | 50 fl oz | +45% |
| Queen Bed with Mattress | +43% | |
| Apartment – 1 Bedroom Housing | George Town | +43% |
| Ripe Bananas (Not organic) | per lb | +37% |
| Men’s Long Jeans Pants | Average | +37% |
| Vegetable oil | 48 OZ | +35% |
| Grapes – Red seedless | per lb | +35% |
| Living Room Suite | 2pc | +34% |
| Women’s Dresses – Casual | Average | +34% |
| Irish potatoes – Idaho | 5 lb bag | +31% |
| Instant coffee – Classic | 7 oz | +30% |
| Diesel | per gal | +28% |
| Petrol – Premium | per gal | +27% |
| Window Cleaner | 23 fl oz | +26% |
| Deodorant | 2.6 oz | +25% |
| Paper Napkins – 1ply | 200 ct | +24% |
| Petrol – Regular | per gal | +23% |
| Comprehensive Vehicle Insurance | Annual | +20% |
| Boys’ Underwear/Underpants – 3 pk | Average | +19% |
| Cigarettes – Regular | 10 ct | +18% |
| Tea – 100% Natural | 100 bags | +17% |
| Tuna Fish – Canned | 5oz | +17% |
| Infant Boy Short Pants – Casual | Each | +12% |
| Sliced Brown Bread – Whole Wheat | 20 oz | +10% |
| Red Delicious Apples | per lb | +7% |
| Beer – Local | 24-case | +4% |
| Drugs for Diabetes – Metformin 500 mg | 30 Tablets | +2% |
| Beer – Local | 12 oz | +1% |
| Men’s Short Pants – Casual | Average | ���16% |
| Cribs | ���20% | |
| Drugs for Stomach Problems – Lansoprazole 30 mg | 30 Tablets | ���26% |
Source: Cayman Islands Economics and Statistics Office consumer price data; changes calculated by Marla Dukharan, December 2016 to December 2024.
This CPI data show that the spectrum of price changes by item in the first place is very broad – from +220% to -26% in eight years, so there is no consistent pattern, while the total increase was 33% for that period. The level of consumption created by a growing population and rising tourist arrivals will no doubt drive prices higher, but Government spending – which is the highest per capita in the region, and which is spent mostly on personnel who also consume – likely drives prices higher as well.
This UNICEF report shows that the cost of a healthy basket of food is actually lower in Cayman than all Caribbean countries apart from the Turks and Caicos Islands. So while the cost of living in Cayman is the second highest in the Caribbean, this is apparently not driven by the cost of a healthy diet (ripe plantain aside!).
Cost of a healthy dietPPP dollars per person per day012345674.054.755.045.165.175.235.45.545.545.565.835.96.026.216.366.43Caribbean av.TCICaymanArubaSt. KittsSt. LuciaSint MaartenBVIDom.RepBahamasCura��aoT&TGrenadaA&BJamaicaHaitiDominicaSt. VincentSource: UNICEF, Marla Dukharan
Housing prices increased anywhere from 43% to 75% in eight years, depending on size and location, as reflected on the above list. Indeed, the ESO data on consumer prices shows that there has been a 47% increase in the category “Housing and Utilities” – the largest increase across all twelve categories of goods and services in the Consumer Price Index basket from December 2016 to December 2024.
Beyond the increase in the cost of building materials and utilities, the 47% increase in “Housing and Utilities” prices may also have been caused by the housing shortage driving up the cost of property in Cayman as a recent Compass article discussed in detail. This phenomenon is not strictly a consequence of population growth; it is also a socio-economic (mis)management problem based on a longstanding lack of proper planning on the part of the authorities, who have failed to ensure that adequate housing is constructed to accommodate the people they allow into Cayman to live and work – and who they collect(ed) work permit fees from!
Population and pain
This brings me to Mount Trashmore.
A recent Compass article stated “Each person on the island disposes of around seven pounds of waste every day. That means every resident is contributing between 10 and 20 times their own bodyweight to the growing mountain of trash every year. Within a decade at the outside, the space will run out.”
Certainly the growing population and tourist arrivals are contributing to Mount Trashmore’s expansion. But is this the fault of the foreign workers and tourists? Or is it the fault of the authorities who have not appropriately provided and expanded proper waste management systems commensurate with the number of people they allow into the country? And what population number does “within a decade” assume, at 7 pounds of waste per person, per day, on average?
There are other negative impacts to the quality of life that are being attributed to the rising population. On the issue of crime in Cayman, which some deem to be the result of population growth and / or the improper vetting / due diligence of certain foreign workers – this is a complex problem and probably has less to do with a growing population (as it is also affecting Caribbean countries with shrinking populations) than with the decades-long trans-national organized crime (gangs, narcotics, weapons and human trafficking) problem in the Caribbean. But again, I believe that the power to make this better rests with the political will of the authorities as demonstrated by Jamaica and Colombia for example, known historically for their narco-trafficking problems, having made significant progress in addressing these issues. And proper vetting is fundamental to any immigration / work permitting process, which itself seems to have been targeted by fraudsters.
The congestion (and aggression!) on the roads in Grand Cayman is truly remarkable, and it would appear that a new public transportation system is in the works. But again, like the housing shortage, poor waste management, and crime, I believe traffic jams can be managed if not avoided with proper planning and management of the country, as Singapore has done. And for anyone tempted to come for me in my DM’s because comparing Cayman to Singapore seems unfair, consider this – on a per capita basis, the Government of the Cayman Islands and the Government of Singapore’s annual fiscal spending, are roughly the same.
Reactive policymaking will always mean playing catch up, with adverse consequences for everyone in the meantime.
Cayman is not alone
Even Switzerland, which of course has one of the world’s highest living costs, appears to be struggling with the perceived effects of population growth on its society, such that they held a referendum entitled “No to a Switzerland with 10 Million!” as their population hit 9.1 million at the end of 2025. Like Cayman, Switzerland relies heavily on foreign labour, and this is a key driver of population growth; “Switzerland has experienced rapid population growth, largely driven by immigration, with the population increasing by 1.9 million people since 2000, according to think tank Avenir Suisse. The country’s population exceeded 9 million last year, with foreign nationals accounting for around 27%, according to government data.” In the end, on June 14th 2026, Swiss voters did not support the proposed cap on the population size.
Like Cayman, Switzerland offers a safe and peaceful environment, a high standard of living and high wages, making it an attractive place to live, work, and raise families. So Cayman is not alone – Switzerland also appears to be a victim of its own success in this sense.
But is population growth via net inward migration truly the source of the discomfort being experienced by the people of the Cayman Islands, and the Swiss? Or is poor planning and economic mis-management the true underlying problem? Are there other factors at play?
Asking an honest question here.
Because throughout history, and recently as well – from Brexit, to Venezuelans, Haitians and Cubans fleeing to neighbouring Caribbean countries, to the (political) sentiment in the USA – it would appear that immigration is somehow consistently and almost universally blamed for whatever undesirable socio-economic and even personal outcomes we are struggling with.
Some other perspectives to consider:
- Rapid change of any kind, whether immigration driven, demographic, geopolitical, economic, cultural, physical, hormonal – will make us uncomfortable. And we are living in a time of rapid change globally – not just in Cayman.
- There are other factors unrelated to population, driving living costs higher in Cayman, such as relatively high energy prices, domestic monetary policy which is derived wholesale from US monetary policy, as well as fiscal policy – particularly the Government’s massive and growing budget, and its regressive taxation framework. These factors affecting the cost of living can be addressed via Government policy regardless of the population size.
Monthly Basic Earnings CaymanianShare of total workforce at earnings level (%)Caymanian Share of Total WorkersCaymanian as a % of Total Wage Earners020406080>16,80057514,400 – 16,79927812,000 – 14,3993609,600 – 11,9995577,200 -9,59910554,800 – 7,19925622,400-4,7993450<2,3991626Source: Economics & Statistics Office, Marla Dukharan
- Had Caymanian and Permanent Resident (PR) wages kept pace with the cost of living (including housing), they would not have experienced weaker spending power. But as you can see from the chart, and as I discussed in this 2024 report, Caymanians dominate the middle-to-low wage jobs; 75% of employed Caymanians earn KYD7,199 or less per month.
- The reason is that “there is simply a shortage of appropriately-skilled Caymanians to fill the high-skilled, higher-wage posts. And this is not likely to change as only 27% of students in Government primary schools and 37.5% at Government secondary schools are achieving the expected standards in their education. This is at odds with a country of Cayman’s GDP per capita and the level of fiscal spending on education. It suggests that Cayman will likely have to continue to outsource its most highly paid and highly sought after jobs for the foreseeable future.” Net inward migration is NOT responsible for poor education outcomes. Government policy and the (mis)management of education is largely responsible for these poor education outcomes, but parenting (or the lack thereof) is also a significant factor.
- That report also stated – “Furthermore, a skills-gap analysis has not yet been conducted in Cayman – which would tell us the specific skills employers need vs the existing skillset of the Caymanian workforce. Such an analysis would also inform what skills should be taught in schools and enable the development of an education and training strategy to fill those gaps – assuming that Caymanians want to live and work in Cayman, in existing sectors and roles.” And a skills gap analysis will help to determine the future demand for local and foreign labour so we can plan carefully from a housing and infrastructure standpoint.
- It is always easier to blame someone else (especially those who are not like us) for the problems we are experiencing. And politicians globally, especially the far right, have had quite an innings exploiting this human weakness, and stoking if not weaponizing xenophobic / anti-immigration sentiment.
Ultimately, the responsibility rests with the authorities to make it all make sense – to plan properly to accommodate the foreign labour and tourists that they allow to enter, and to avoid and mitigate the negative effects on their people as far as possible. Singapore is a brilliant example of what’s possible with a vision, proper planning, and accountability for implementation.
Plans and plagues
Back in 1999, Cayman had a Vision 2008 – “The overall objective of this Strategic Plan is to secure a future of harmony and prosperity through balanced growth” – but it succumbed to the implementation deficit plague. Fortunately, the Chamber of Commerce’s Government Accountability Scorecard could inoculate any future Vision or Strategic Plan from this plague, provided that the Scorecard itself is designed and implemented correctly. And while Vision 2008 did not articulate a specific population target, it could still represent a good starting point on which to build, augmented by a consensus around population target, given our better understanding of how population affects, and is affected by, overall economic activity and Government finances.
One factor that might explain Cayman’s – and possibly also Switzerland’s – lack of proper policy formulation, planning, and execution as it relates to the Vision 2008, and the unsatisfactory socio-economic outcomes for everyone alongside rapid population growth, is inequality.
“Economic inequality is one of the strongest predictors of where and when democracy erodes—even wealthy and longstanding democracies are vulnerable if they are highly unequal” because the wealthy elite, via corrupt practices, election campaign financing, and ownership of media for example, increasingly shape Government policy and (dis)regulation in their favour, so that they can consolidate power and further increase their wealth – driving even higher levels of inequality! And this is how economic inequality is self-perpetuating, and also drives poverty.
Gini Coefficient of 178 Countries0=perfect equality, 100= perfect inequality010203040506070Cayman IslandsLowest inequalityHighest inequalitySource: ESO, CIA World Factbook, Marla Dukharan
The Gini coefficient which measures inequality, has improved only slightly since 2007 in the Cayman Islands –
- 0.3995(household survey 2007)
- 0.3779(Household survey 2015)
- 0.388(quality of life survey 2024)
With a Gini coefficient of 33.8 in 2025, Switzerland’s inequality is better than Cayman’s, but remains relatively unchanged since 2002.
According to a recent study, inequality and poverty are not accidental – they are manufactured, and can therefore be reversed with the right policies – “For decades, the recipe was simple: grow the economy, and poverty would gradually disappear. But the promise that economic growth would “lift all boats” has not been kept. While national incomes expanded, wages stagnated, work became more precarious and public services were cut. At the top, fortunes ballooned; at the bottom, families turned to food banks. Growth has become decoupled from shared prosperity. Poverty and inequality are not accidents; they are predictable outcomes of policy choices: how we design tax systems, regulate labour markets, value care, structure public services and decide whose needs and whose voices matter. Crucially, if governments can manufacture poverty, they can also dismantle it.”
Interesting that two countries with high living standards and enviable economic growth and prosperity, to the extent that they are able to attract highly skilled foreign workers, have not been able to meaningfully reduce their inequality, and their people appear to be dissatisfied.
What to do?
Campaign finance reform is a relatively easy and obvious starting point in addressing the extent to which the wealthy are able to directly shape political outcomes, policy formulation, and regulations in their favour, at the expense of everyone else and the planet.
Furthermore, an informed, consensus driven vision, supported by an independent and representative body holding the Government to account (regularly and publicly) for implementation, could be the formula to escape this unnecessary social discontent.
Conclusion: what is Cayman’s vision for its future?
Here is a summary of the correlations calculated and cited in this report, demonstrating the relationships between important factors in the Cayman Islands economy:
Correlations cited in this report
Correlation between each pair of factors, Cayman Islands
Government revenues × GDP (according to the Government)99.9%
Population growth rate × inflation rate98%
Nominal GDP × non-Caymanian population (2018-2022)97%
Government spending × public sector employment (70% of which is Caymanian)96%
Public sector workers × work permits91%
Nominal GDP × Caymanian population (2018-2022)86%
Public sector × private sector employment75%
Correlation is not causation; the direction of each relationship is discussed in the body of the report. The population-inflation correlation runs mainly via property / housing prices.
In summary, this report demonstrates:
- That higher population levels (particularly high-wage foreign workers) mean higher levels of Government revenue via work permit fees and coercive revenue.
- That the construction sector has the highest economic multipliers, such that higher levels of construction activity cause higher levels of overall economic activity, and more so than any other sector.
- That higher population levels (particularly high-wage foreign workers) mean higher levels of economic activity or GDP in any event, via construction, consumption, etc.
- That higher levels of economic activity or GDP mean higher levels of Government revenue.
- The majority of the Government’s spending is on personnel costs, which is funded mainly by the Financial Services sector and (high-wage) work-permit holders in other sectors, and the coercive revenue and demand for construction activity they create.
Therefore, the Government of the Cayman Islands is highly incentivized to continue to support growth in the (high-wage) non-Caymanian population in order to grow its revenue, and to continue to support construction activity in order to grow the economy, and therefore grow its revenue. The majority of the Government’s revenue is redistributed to the Caymanian population via the state’s personnel costs (70% Caymanian) and other social spending.
As of May 1st 2026, the Government effected significant immigration reform, making it more costly and more difficult for foreigners to live and work in the Cayman Islands. The effects of these reforms will take some time to be revealed and then analyzed.
It is possible that these recent immigration reforms may dampen the demand for work permits and slow non-Caymanian population growth, which could have knock-on effects on the level of construction activity, the level of economic activity or GDP, and the level of fiscal revenue – as these are all dynamic and inter-dependent variables. Reduced demand for work permits in Cayman will likely mean less Government revenue from those sources, and could lower demand for housing, schools, infrastructure etc. leading to slower levels of construction activity, which will likely dampen economic activity or GDP, which could reduce Government revenue and therefore Government spending, which could negatively affect the Government’s quality and level services provided. And all of these possible effects and changes will have different implications for everyone.
Bottom line – the size of and changes to the non-Caymanian population is a fundamental factor directly and indirectly affecting broader fiscal and socio-economic outcomes.
“
But in the absence of a plan, with their eyes wide shut, the people of the Cayman Islands are heading towards an unknown population size, by default.
Remember, the best way to predict your future is to create it. Furthermore – vox populi, vox dei; a decision and an outcome driven by consensus, given the inherent wisdom of many and the strength in diversity, has a greater chance of improving the lives of the majority. And the people of the Cayman Islands understand and employ this dynamic better than most.